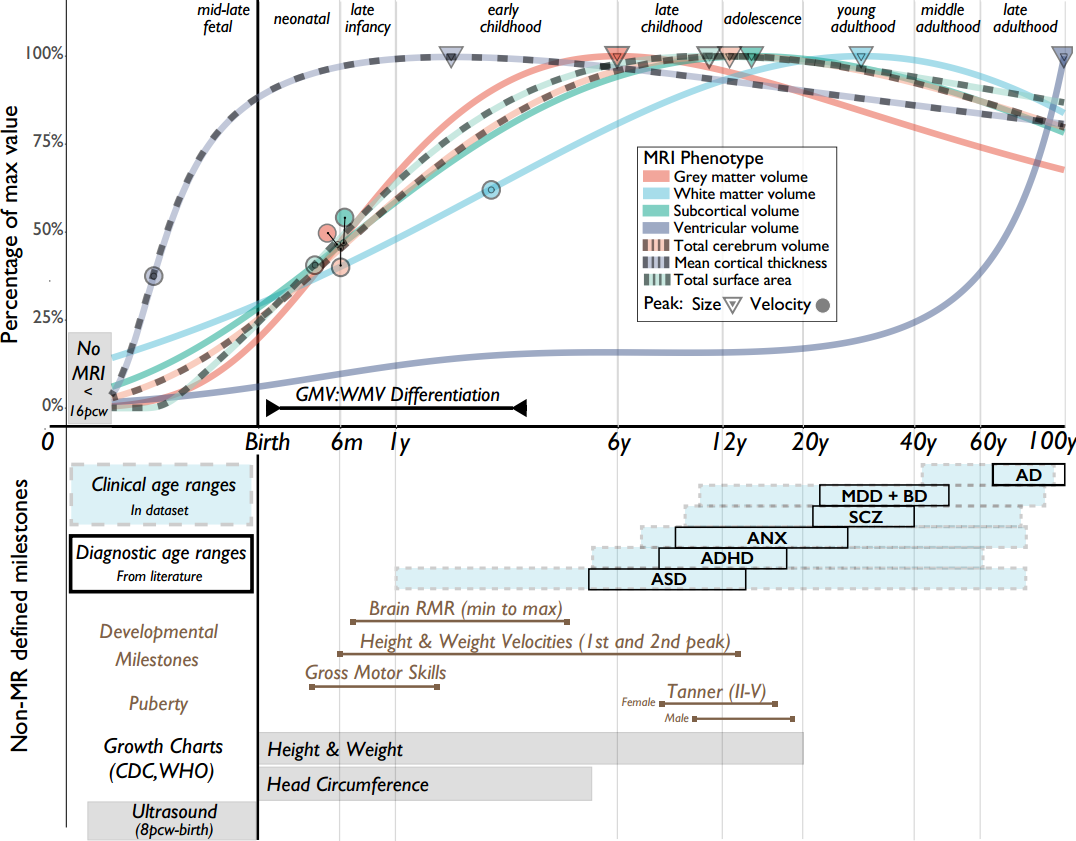
Nature published an online article ‘Brain charts for the human lifespan’ with the participation of Xi-Nian Zuo’s lab on April 6, 2022. This study revealing the human brain developmental milestones across the lifespan (from 16 weeks after conception to 100 years of age) (Fig. 1) [1]. Nature reported this landmark study under the title " Neuroscience: Reference charts for human brain development", stating that "These charts — constructed through the analysis of brain scans from more than 100,000 participants worldwide — could have potential future applications for the digital assessment of brain health and disease diagnosis at any age".

Fig. 1 Neurodevelopmental milestones across the lifespan
More than 200 years ago, Dr. Count Philibert de Montbeillard plotted the first growth chart to monitor his son's height from birth to age 18 years. A growth chart represents a breathtaking composite of anthropometric measurements, statistical summaries, and chart designs, which is usually regarded as a " road to health," and the benchmark of clinical pediatric medicine. There are currently no standard references to quantify the maturation and healthy ageing of the human brain, unlike growth charts used to measure traits such as height and weight in children, for example. To address this issue, researchers from more than 200 research institutes around the world collated data from 123,984 MRI brain scans of 101,457 individuals aged between 115 days after conception and 100 years old. Using the statistical modeling method GAMLSS recommended by WHO, the team created charts of normal brain development across a lifetime, which could be used to generate ‘centile scores’ to determine whether an individual is on a standard trajectory. These charts — which were separated according to sex — were stable in their predictions, despite study-specific differences in both the individuals assessed and the techniques and methods used. Critical developmental periods — such as an approximate 70% increase in the size of the brain between the time before 17 weeks after conception and 3 years of age — were revealed (Fig. 1).
The authors emphasize that substantial, future research will be needed before these results can be put into clinical practice. Caveats, such as potential data bias towards European and North American populations and individuals of European ancestry within these groups, will also need to be addressed. On the one hand, the present database already includes some public dataset samples from different culture (e.g. China, Singapore, India), such as the "1000 Functional Connectomes Project" (FCP) [2] and the "Consortium for Reliability and Reproducibility" (CORR) [3] in which China participated or led. On the other hand, by providing these charts in an interactive, open-access format, it is expected that the database will continue to evolve to eliminate such bias.
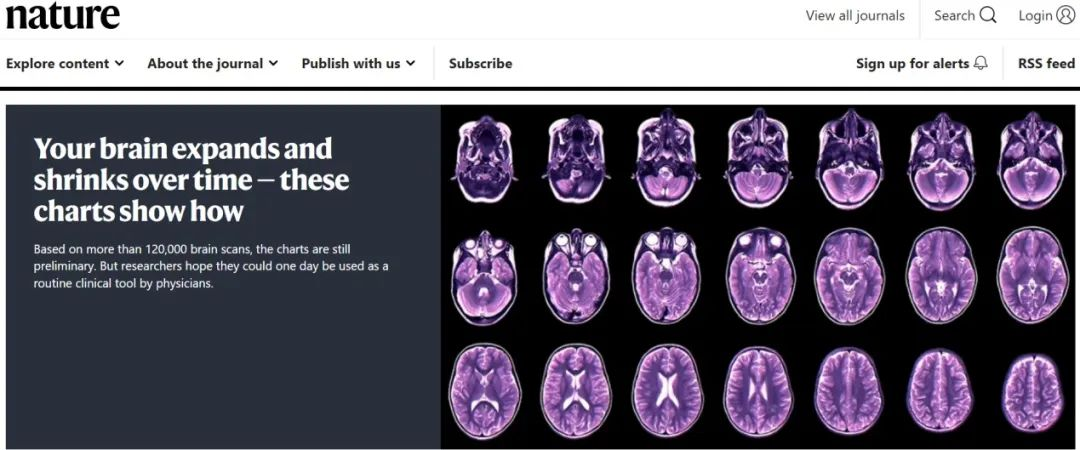
Two projects led by Xi-Nian Zuo’s lab, "Chinese Color Nest Project: Growing up in China" (CCNP) [4] and "3R-Brain Consortium " (3R-BRAIN: https://github.com/zuoxinian/3R- BRAIN), participated in this large-scale team-based brain research, and contributed more than one thousand brain scan data. Zuo lab is one of the pioneers to study human brain MRI charts, and is the first to use GAMLSS for the modeling of human brain charts across lifespan [5]. Based on the “measurement-cohort-theory” brain charts research [6,7], his team developed a reliable and valid statistical framework for the measurement of individual differences in brain and intelligence [8], constructed the CCNP cohort [9], found the differences in the brain development patterns between Chinese and American children [10], and revealed the shifting gradients of macroscale cortical organization from childhood to adolescence [11]. Currently, the team is keeping eyes on clinical translation of brain charts. Nature summarized this research on its website (Fig. 2) [12], and published an editorial [13] to emphasize that the contribution of open data authors should be recognized.

Fig. 2 The headline on the Nature website summarizes human brain development across lifespan
Dr. Ning Yang, Dr. Yin-Shan Wang and Prof. Xi-Nian Zuo from the state key laboratory of cognitive neuroscience and learning, Beijing Normal University are co-authors of this article. 3R-Brain and CCNP are consortium co-authors. The building and development of CCNP and 3R-Brain have been supported by funds and institutes including the Ministry of Science and Technology of China, National Natural science Foundation of China, National Basic Science Data Center, Chinese Academy of Sciences, Beijing Municipal Science & Technology Commission, Beijing Normal University.
References
[1] Brain charts for the human lifespan (2022) Nature, 604:525–533.
[2] Toward discovery science of human brain function (2010) PNAS, 107:4734-9.
[3] An open science resource for establishing reliability and reproducibility infunctional connectomics (2014) Scientific Data, 1:140049.
[4] Chinese Color Nest Project: Growing up in China (2017) Chinese Science Bulletin, 62:3008-22.
[5] A Connectome Computation System for discovery science of brain (2015) Science Bulletin, 60:86-95.
[6] Human connectomics across the life span (2017) Trends in Cognitive Sciences, 21:32-42.
[7] Neuroimaging brain growth charts: A road to mental health (2021) Psychoradiology, 1:272-86.
[8] Harnessing reliability for neuroscience research (2019) Nature Human Behaviour, 3:768-71.
[9] Chinese Color Nest Project: An accelerated longitudinal brain-mind cohort (2021) Developmental Cognitive Neuroscience, 52:101020.
[10] Charting brain growth in tandem with brain templates at school age (2020) Science Bulletin, 65:1924-34.
[11] Shifting gradients of macroscale cortical organization mark the transition from childhood to adolescence (2021) PNAS, 118:e2024448118.
[12] Your brain expands and shrinks over time — these charts show how (2022) Nature, doi: 10.1038/d41586-022-00971-1.
[13] Editorial: Time to recognize authorship of open data (2022) Nature, doi:10.1038/d41586-022-00921-x.