Science Bulletin published a News & Views paper titled "Connectome Computation System: 2015-2021 updates" on March 10, 2022 [1]. It introduces the last five years’ progress of the human brain connectome computation system (CCS) that was developed by Xi-Nian Zuo’s laboratory. Related updates are accessible at https://github.com/zuoxinian/CCS.
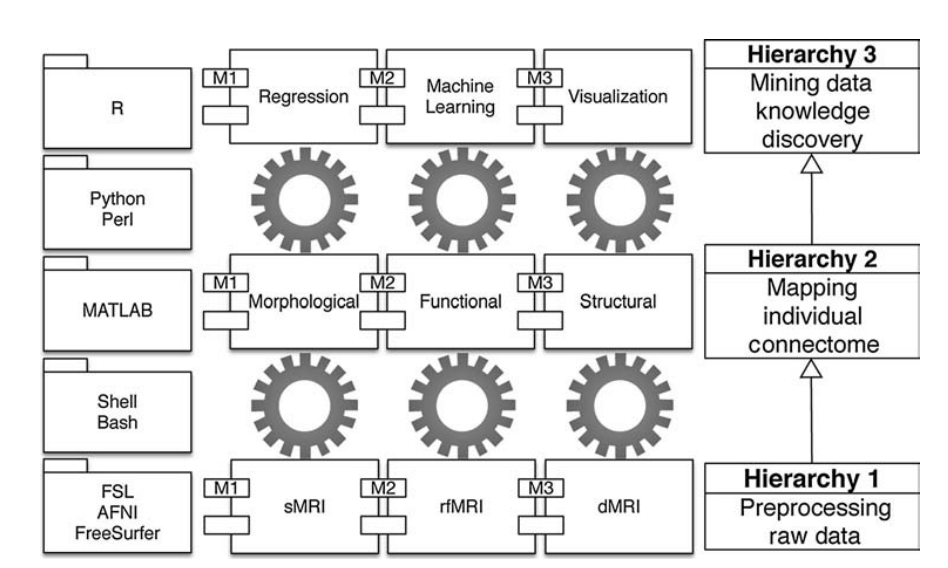
CCS was firstly reported in the Science Bulletin in 2015 [2]. It’s structure is a three-level hierarchical organization including low-level data cleaning and preprocessing (H1), mid-level individual connectome mapping (H2) and high-level connectome mining and knowledge discovery (H3) (Fig.1). All three (H1, H2, and H3) modules of CCS were updated during 2015-2021. This News & Views would introduce six major updates.

Fig. 1 Diagrammatic sketch of CCS.
Update 1. In sharing neuroimaging data, the protection of identifiable facial features is of paramount importance. Now, CCS includes the face-masking tool to anonymize the facial information. We recently demonstrated an effect of head template on the face-making use, indicating a better performance of the facial anonymization with the Chinese head templates than that with the Western templates for obscuring the faces of Chinese brain images, and vice versa. Accordingly, we released the Chinese head templates reconstructed from the Chinese Human Connectome Project (CHCP) and the developing component of the Chinese Color Nest Project (devCCNP) as parts of the CCS updates (https://github.com/zuoxinian/CCS/tree/master/templates).
Update 2. Accurate brain extraction or skull stripping is critical for quantitative brain imaging analysis, especially for morphological measurements such as cortical thickness and surface area. In the 2015 release, CCS first removed the spatial non-local noise using an adaptive algorithm (SANLM) and then extracted the brain using the FreeSurfer toolkit with some manual tweaks. This has been platform-crossing and time-consuming while an online MRI segmentation system, volBrain integrated the two steps. However, the volBrain’s performance on brain extraction was largely influenced by the facial anonymization. The updated CCS employed a deep learning method for brain extraction based on the face-masked data. Of note, multiple U-net models were trained for Chinese pediatric brain extraction using head and brain MRI images from devCCNP. The new-version CCS combined the SANLM function with the brain extraction models to achieve a more integrative pipeline.
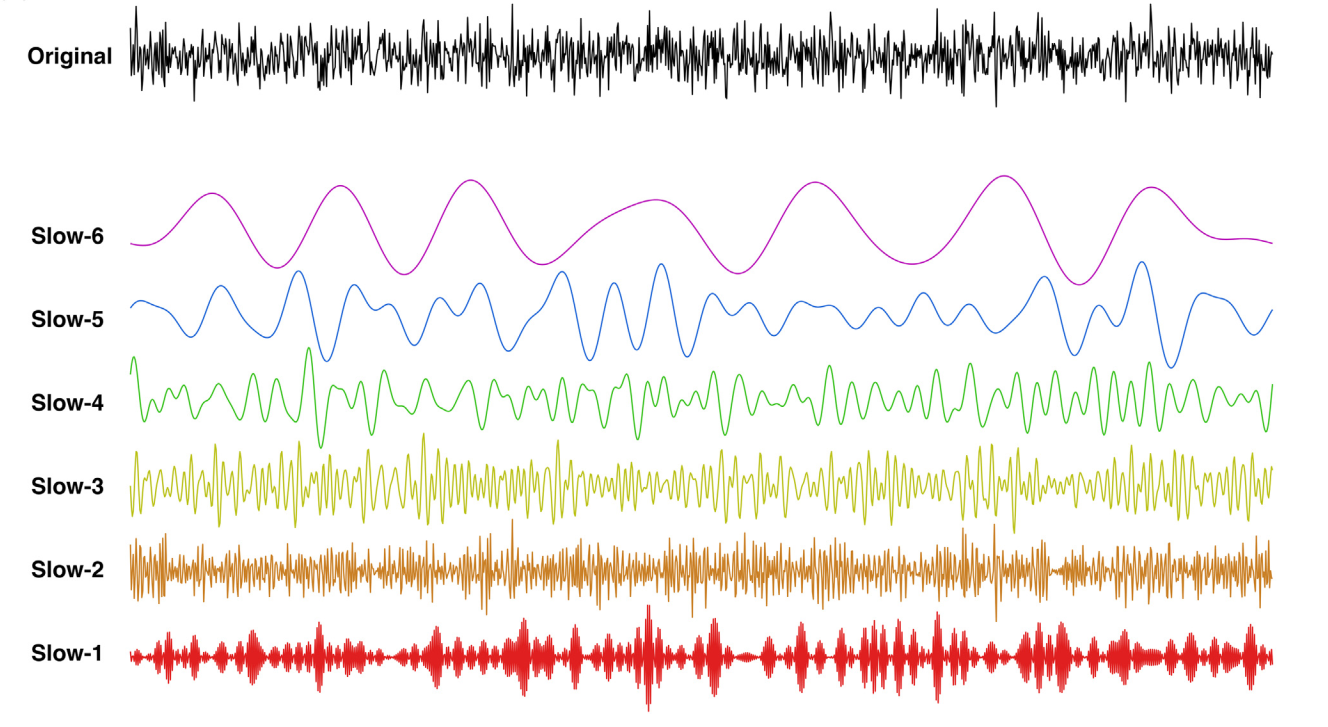
Update 3. Neural oscillations generate rhythms of the brain at multiple frequency bands, which correspond to specific physiological processes, respectively. In the CCS updates, we included an open toolbox with a graphical user interface for decoding rhythms of the brain system (DREAM) [3]. It can precisely compute the number and ranges of decodable frequency bands using the sampling parameters. The new CCS offers DREAM as a reliable and valid tool to discover brain waves from multiple frequency windows of the resting-state functional MRI (rfMRI) signal. As one example, Fig. 2 displays data from the left human amygdala of a single subject from the HCP young adult release.

Fig. 2 DREAM decodes multiband resting state BOLD signal fluctuations in the amygdala
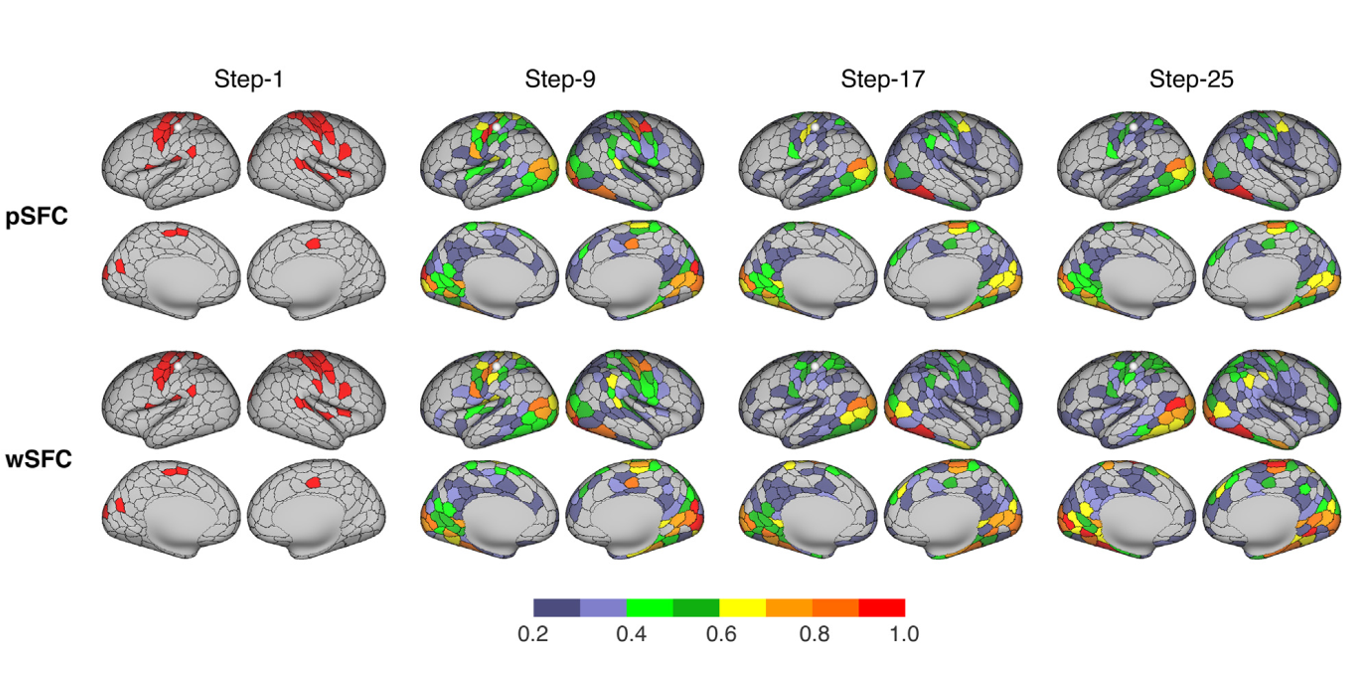
Update 4. CCS updates the individual mapping with recent advances on walk-based algorithms for network metrics. We introduced multiple network centrality metrics based on walks of a brain graph in the original CCS release, which can be formulated as a function of the graph’s adjacency matrix A. In CCS 2021, we take the stepwise connectivity as an example of the walk-based method to show how we update the centrality metrics by introducing different types of walks. Specifically, for a given seed node, the n-step connectivity of any other node is the number of walks of length n between this node and the seed node. In this release of CCS updates, we constrain the computation with nonbacktracking walks (NBTW), never continuing along the reverse of the edge arrived. In Fig. 3, we demonstrated an individual connectome mapping of stepwise connectivity for both common walks (wSFC) and nonbacktracking walks (pSFC) of lengths of 1, 9, 17, and 25 using the 400-parcel cortical parcellation.

Fig. 3 The computation of stepwise functional connectivity (The walk seed was a parcel in the left sensory motor network, and indicated as a white sphere on the cortical surface).
Update 5. Another key CCS update is the reliability module. In this version, CCS offers a selection of intraclass correlation (ICC) models using the Linear Mixed Model (LMM) for assessing measurement reliability. Traditionally, the ICC calculation is defined under the analysis of variance (ANOVA) framework—the ratio of the difference between between-subjects mean square (MSb) and within-subject mean square (MSw) divided by the sum of MSb and MSw. However, when MSb term is lower than MSw, the ANOVA approach results in a negative ICC value. To overcome this issue, we adopted the LMM with the restricted maximum likelihood (ReML) estimation method. This guarantees non-negative ICC values and avoids uninterpretable negative estimation under the ANOVA framework. More importantly, the LMM provides the flexibility to handle confounding variables at different levels in the same model (e.g., age, sex at the subject level, and head motion at the session level). Users can thus specify the confounding variables and include them as covariates in the model [4]. The updated CCS implements all classic types of ICC and offers an online version of the reliability computation, which is no need for predeterminant on the statistical models (http://ibraindata.com/research/reliableFNN/reliabilityassessment).
Update 6. A normative modeling method (NMM) has been implemented in the updated CCS (https://github.com/zuoxinian/CCS/tree/master/H3/nmm). Such an implementation is inspired by the utility of growth charts in pediatric clinical practice, but generalizable to lifespan brain charts. Specifically, given an individual brain metric X, its normative d-score can be derived by overlaying X onto the canonical charts matched to the individual age and sex. Such a score is defined as the norm-version Z-score. NMM combines normal participants’ information with small-sample studies by controlling effects of both age and sex (other factors as well) in a more realistic manner than with the common methods (e.g., case-control). We demonstrated the promise of using NMM for experimental designs where it is difficult to recruit healthy controls (e.g., rare clinical conditions) by offering a healthy or normal reference and improving the reproducibility of findings. We built a series of growth charts on brain development at school age (6–18 years) and shared via the CCS website (https://github.com/zuoxinian/CCS/tree/master/H3/GrowthCharts).
Reliable neuroimaging data analytic workflows have become the core demand of various national and regional brain science projects. The variability of these pipelines has attracted more attention [5]. A recent study on analysis-related variation in neuroscience showed that the processing consistency between ABCD-BIDS, CCS, C-PAC and fMRI-Prep was almost perfect [6]. CCS is developed by a highly interdisciplinary team. Members of the team are from Department of Applied Mathematics of Beijing University of Technology, the State Key Laboratory of Cognitive Neuroscience and Learning of Beijing Normal University, Center for the Developing Brain of Child Mind Institute, National Basic Science Data Center, School of Psychology of Capital Normal University, the Institute of Psychology of Chinese Academy of Sciences, and Department of Computer Sciences of Taiyuan University of Technology.
References
[1] Xing X, Xu T, Jiang C, et al. Connectome computation system: 2015–2021 updates. Science Bulletin 2022; 67(5): 448-451.
[2] Xu T, Yang Z, Jiang L, Xing X, Zuo XN. A Connectome Computation System for discovery science of brain. Science Bulletin 2015; 60(1): 86-95.
[3] Gong ZQ, Gao P, Jiang C, Dong HM, White T, Castellanos FX, Li HF, Zuo XN. DREAM: A Toolbox to Decode Rhythms of the Brain System. Neuroinformatics 2021; 19(3): 529-545.
[4] Jiang C, Betzel R, He Y, Wang YS, Xing XX, Zuo XN. Building functional network neuroscience for reliable individual differences. Research Square 2021; preprint version, doi: https://doi.org/10.21203/rs.3.rs-918598/v1.
[5] Botvinik-Nezer R, et al. Variability in the analysis of a single neuroimaging dataset by many teams. Nature 2020; 582(7810): 84-88.
[6] Li X, et al. Moving Beyond Processing and Analysis-Related Variation in Neuroscience. bioRxiv 2021; preprint version, doi: https://doi.org/10.1101/2021.12.01.470790